Talent management metrics are the measures an organization uses to tell whether the systems that staff, develop, move and retain its people are producing the results the business needs. HR and other professionals design and implement training, but also manage other systems that build people-capability, such as strategic staffing processes, succession planning systems and management development. These initiatives have the potential to make significant improvements. Here are a few of these improvements and ways to measure talent management effectiveness.
Most lists of talent management metrics run to a dozen or more measures with formulas attached. That is useful for definitions and less useful when a sponsor asks whether the succession process is working or whether the new manager program was worth the effort. Our recommendation is to organize the metrics by the system that produces them, choose two or three for each initiative, decide the data source and cadence before the work starts and report the results on one page. The sections below cover what the metrics are and how they differ from key performance indicators (KPIs), what to measure in each of four talent management systems, how to turn the measures into targets and how to build a scorecard leadership will read.
What talent management metrics are, and how they differ from KPIs
A talent management metric is any measure that describes how a talent system is performing: days to fill an open position, the share of key positions with a ready successor, first-year turnover on the teams of new managers. A talent management KPI is a metric the organization has agreed to manage against, with a baseline, a target, an owner and a review cadence. Every KPI is a metric; few metrics deserve to be KPIs. A helpful sorting rule is that a metric becomes a KPI when a specific leader would change a decision if the number moved.
Two further distinctions help when choosing. Leading indicators describe conditions that tend to produce a result later, such as the share of development actions finished on schedule or the number of candidates in a succession pool. Lagging indicators describe the result itself, such as the internal fill rate for key positions or the performance of placed successors after a year. A balanced set carries both, because leading indicators tell you what to fix now and lagging indicators tell you whether the fixes worked.
Expectations for these measures have grown. ISO 30414:2025, the international standard for human capital reporting and disclosure, sets out eleven core reporting areas. Among them are recruitment; mobility and succession planning; workforce turnover; leadership, culture and engagement; and skills, capabilities and development [1]. Since 2020, U.S. public companies have been required to describe their human capital resources, including any human capital measures or objectives they focus on in managing the business, where that information is material to an understanding of the business [2]. Talent metrics that once lived in an HR presentation now appear in annual reports and board materials, which raises the standard for definitions, data quality and consistency from one period to the next.
Four key activities to improve talent management effectiveness
A single list of metrics hides where a problem sits. A rising turnover rate could point at hiring, at the first year on the job, at managers or at a lack of internal movement, and each of those has a different owner and a different fix. Organizing the measures by the system that produces them keeps the diagnosis attached to the people who can act on it.
The graphic below outlines four systems that build people-capability, and the rest of this article follows them.
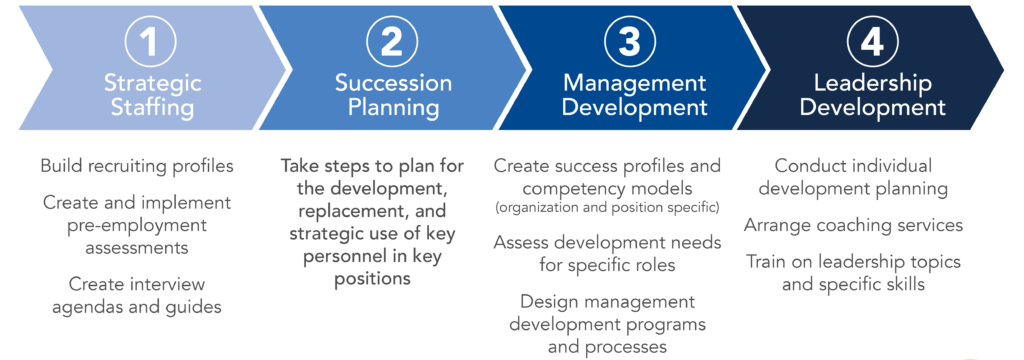
| System | What It Exists To Produce | The Question Its Metrics Answer |
|---|---|---|
| Strategic staffing | The right person in each role, hired efficiently and retained | Are we hiring people who succeed and stay? |
| Succession planning | Ready successors for key positions before they are needed | Could we fill our key positions from inside, and how soon? |
| Management development | Managers who run their teams well from the first months in the role | Are teams experiencing better managers? |
| Leadership development | A stronger leadership pipeline and leaders who behave differently | Is the bench deeper, and did the investment go to the right people? |
Performance management, engagement and compensation sit alongside these four. We treat them here as inputs and outcomes rather than as separate systems; our article on getting high performers from a performance management system covers that process on its own.
Strategic staffing metrics
Strategic staffing processes can include building recruiting profiles, creating and implementing pre-employment assessments, creating interview agendas and guides, identifying behavioral anchor points for specific roles and training managers on how to conduct interviews. Our guide to hiring process steps and its four-minute video outline the components. Measure these processes effectively using metrics such as:
- Reduced time to fill open positions.
- Improved quality of candidates.
- Improved number of candidates.
- Reduced compliance-related grievances.
- Reduced cost to hire.
- Improved length of tenure.
- Improved productivity in the first 90 days of employment.
- Improved morale.
- Improved retention of key employees.
Of these, the measures that tend to move sponsors are the quality measures rather than the speed measures. Time to fill is easy to collect and easy to game, and a shorter search that produces a poor fit costs more than a longer one. SHRM's benchmarking put the average cost per hire at nearly $4,700, and many employers estimate the full cost of a hire, including the time of managers and HR professionals, at three to four times the position's salary [3]. Quality of hire, first-year retention and time to productivity carry that cost story in terms leaders recognize.
| Metric | What It Tells You | Data Source | Cadence |
|---|---|---|---|
| Time to fill (days from approved requisition to accepted offer) | Process speed and recruiting capacity | Applicant tracking system | Monthly |
| Quality of hire (first-year performance rating, 90-day productivity milestones, hiring manager rating at six months) | Whether the recruiting profile and assessments predict success in the role | Performance system, hiring manager survey | Quarterly |
| First-year retention of new hires | Fit and onboarding quality | HRIS | Quarterly |
| Offer acceptance rate | Competitiveness of the offer and the candidate experience | Applicant tracking system | Monthly |
| Cost per hire | Efficiency, compared within the organization over time | Finance and recruiting records | Annual |
| Compliance-related grievances from hiring | Consistency of interview practice across managers | HR case records | Quarterly |
Two notes on the data. Pre-employment instruments used for selection need to be validated for that purpose and checked for cultural and other bias; our assessment services page describes how we select and implement them. The first-year measures, such as time to productivity, depend on the onboarding process as much as on the hire, and our employee onboarding process guide covers how to measure that phase.
Here is an example of assessment data serving both selection and development. Organizations often use sales assessments for selection, screening candidates before a hire or a promotion from within, and for development. A global organization asked PPS International Limited to design a sales assessment center for its sales representatives, combining a customized 360-degree survey, a preference instrument, an emotional intelligence measure and structured interviews, all aligned to the client's success profile. The measures that mattered were the alignment between each representative's results and the success profile and the development plans that followed, rather than any single score. The same success profile is the starting point for interview guides and selection instruments, which is why we treat assessment data as a staffing measure as well as a development one; the sales assessment center case study describes the instruments, the debrief and how the results were used.
Succession planning metrics
Succession planning is making provisions for the development, replacement and strategic use of key personnel in key positions. Our succession planning process primer walks through the five components and a seven-step sequence. It can be measured with metrics such as:
- Reduced time to fill open key positions because of improved pipeline of candidates.
- Improved quality of candidates for key positions.
- Increased number of candidates for key positions.
- Improved productivity of newly promoted or hired executives due to faster on-boarding processes.
Those four outcomes are where the process shows up in the business. The measures below add the leading indicators that tell you a year earlier whether those outcomes are likely, and they answer the question sponsors ask most often, which is whether the plan is real or a spreadsheet.
| Metric | Definition | What It Tells You | Cadence |
|---|---|---|---|
| Succession coverage | Share of key positions with at least one ready-now successor, and with two or more candidates in the pool | Depth of the bench for the positions that matter | After each talent review |
| Emergency cover | Share of key positions with an interim already identified | Exposure if a vacancy happens tomorrow | After each talent review |
| Internal fill rate for key positions | Key positions filled from inside as a share of all key positions filled | Whether the pipeline produces placements | Annual |
| Pipeline utilization | Key-position placements drawn from the succession pool as a share of all key-position placements | Whether the plan drives decisions or sits beside them | Annual |
| Time to fill key positions | Days from vacancy to start date, internal or external | The cost of a thin bench | Annual |
| Successor retention | Share of identified successors still with the organization 12 months after the review | Whether identified people see a future | Annual |
| Development action completion | Share of development actions from the review finished on schedule | Whether readiness is being built rather than declared | Quarterly |
| Placed-successor performance | Performance of placed successors at six and twelve months | Quality of the readiness ratings | Six and twelve months after placement |
| Pool representation | Composition of the successor pool compared with the workforce | Whether nominations and assessments are missing people | After each talent review |
On targets, we recommend the bench our succession planning primer describes: a pool of at least two candidates for every key position rather than a single successor, at least one ready-now successor for each and emergency cover noted separately. A first talent review rarely meets those targets; the value of the metrics is in showing the gap close from one review to the next. The gap is common. In SHRM's 2024 survey, 21% of organizations reported a formal succession plan, 24% an informal one and 56% none, with lack of time and resources the primary obstacle [4].
Here is an example. A global architecture and event management firm we worked with set out to prepare the next level of owner-leaders while maintaining its culture during growth. Three regions identified the roles that would be stepping points to potential principal roles, and HR leaders in each region conducted talent reviews with senior principals and holdings board members as part of business planning. For a design like that, the measures we recommend are coverage for the stepping-point roles and completion of the development actions agreed in the reviews, tracked from one review to the next, with placed-successor performance added once the first moves happen. Our succession planning primer article describes the process the firm used.
Management development metrics
Management development can include creation of success profiles and competency models specific to the organization and the position, assessment of development needs for specific roles within the company and design and development of management development programs and processes.
Depending upon initiative, measure by:
- Reduced documentation errors on performance reviews.
- Improved consistency in evaluation and reward of employees.
- Reduced number of meetings and number of attendees at meetings.
- Improved quality of decision outcomes.
- Improved buy-in and support to decisions.
- Reduced turnover due to management incompatibility or poor hires.
- Improved recognition of company goals (for instance).
Managers carry much of the engagement result. Gallup's research attributes about 70% of the variance in team engagement to the manager [5], and its 2026 State of the Global Workplace report puts global employee engagement at 20% for 2025 and manager engagement at 22%, down nine points since 2022 [6]. Engagement and early turnover on a manager's team are therefore reasonable outcome measures for a management development program, provided the comparison is fair: managers who completed the program against those still waiting for a later cohort, or the same teams before and after.
| Metric | What It Tells You | Data Source | Cadence |
|---|---|---|---|
| Time to productivity for new managers (essential operational tasks such as one-on-one setups, goal setting and compliance approvals completed without help in the first 30 to 60 days) | Readiness for the operational side of the role | Manager checklist, HRIS | 60 days after start |
| Self-efficacy scores (confidence in core responsibilities such as handling conflict, delivering feedback and using HR tools) | Whether the program built skill and confidence | Post-program survey, repeated at 90 days | 90 days |
| On-time performance conversations (probationary reviews, check-ins and recognition delivered on schedule) | Whether managers are doing the work the program taught | Performance system | Quarterly |
| Early team turnover (voluntary attrition among direct reports of newly trained managers in their first year) | The team's experience of the manager | HRIS | Quarterly |
| Team engagement and a psychological safety pulse | Whether the team is experiencing a different manager | Engagement survey, short pulse | Six months |
| Manager Net Promoter Score (mNPS) | How the team rates the manager | Internal survey | Annual |
| HR and legal escalations (grievances, policy violations and appeals) | Consistency of practice | HR case records | Quarterly |
Here is an example. A client whose parent company has a workforce of more than 270,000 employees, with about 25,000 of them managers, had left new manager development largely to individual plans and savvy HR leaders. The program we designed took 200 first-line managers through a common process across six global regions and earned a 4.9 out of 5.0 rating for relevance and outcomes. The new manager training case study lists the success indicators in the table above in more detail and shows an example learning journey.
Leadership development metrics
Leadership development can include individual development planning, coaching services and training and development on leadership topics and skills.
Measure success by tracking:
- Reduced time to promote because of increased bench strength.
- Reduced financial investment in development because of clarified group and individual needs.
- Less recidivism of skills due to improved learning methodology.
These are system-level outcomes: whether the pipeline is stronger and whether the investment is going to the right people. Measuring an individual leadership program, with baselines, behavioral observation, team pulses and attribution, is a different exercise, and our article on how to measure leadership development lays out that measurement plan. Here we stay at the system level.
| Metric | Definition | Cadence |
|---|---|---|
| Bench strength for leadership roles | Share of leadership positions with a ready-now internal successor (shared with the succession scorecard) | After each talent review |
| Internal promotion rate into leadership roles | Leadership vacancies filled from inside as a share of all leadership vacancies filled | Annual |
| Time to promote | Months from identification as a candidate to placement, for leaders who were placed | Annual |
| Alumni retention | Retention of program participants compared with similar leaders who did not participate | Annual |
| Development plan activity | Share of leaders with a current individual development plan and at least one finished action in the period | Quarterly |
| Behavior change on target behaviors | Movement on two or three behaviors, measured by manager observation or multi-rater feedback at baseline and again at 90 days or later | Per program |
| Investment per developed leader | Development spend divided by leaders developed, tracked against clarified needs rather than headcount | Annual |
Here is an example of a program-level set that feeds the system-level view. A global reinsurance organization we partner with for instructional design and facilitation used a small series of measures for its front-line leader program. Participants self-reported at key points in a blended learning journey on behaviors such as translating strategy into clear, actionable plans and developing and growing talent; at 90 days, more than 84% of those participating in the measurement reported marked improvement, backed by checks of how many had created development plans for their direct reports or held career conversations. The client began with a series that was manageable and specific to current needs and expects to add outcome measures over time.
Talent management KPIs: turning metrics into targets
A metric becomes a KPI when four things are attached to it: a baseline, a target with a date, an owner and a cadence for review. Here is a starting set we often see work, with two per system, so leadership has eight numbers to manage rather than forty.
| KPI | System | Formula Or Definition | Leading Or Lagging |
|---|---|---|---|
| Quality of hire | Strategic staffing | Hires rated at or above expectations at the first-year review, divided by hires in the cohort | Lagging |
| First-year retention | Strategic staffing | New hires still employed at 12 months, divided by hires in the cohort | Lagging |
| Succession coverage | Succession planning | Key positions with at least one ready-now successor, divided by key positions | Leading |
| Internal fill rate for key positions | Succession planning | Key positions filled internally, divided by key positions filled | Lagging |
| On-time performance conversations | Management development | Reviews and check-ins completed on schedule, divided by those due | Leading |
| Early team turnover | Management development | Voluntary exits among direct reports of managers in their first year, divided by those direct reports | Lagging |
| Bench strength for leadership roles | Leadership development | Leadership positions with a ready-now successor, divided by leadership positions | Leading |
| Behavior change on target behaviors | Leadership development | Participants showing improvement on two or three target behaviors at 90 days, by manager observation or multi-rater feedback, divided by participants measured | Lagging |
Set targets from your own baseline rather than from external benchmarks. Benchmarks vary by industry, region and how each organization defines the measure, so a figure such as SHRM's cost per hire is useful for scale and poor as a target. A realistic first-year target is often movement in the right direction on every KPI and a specific improvement on the one or two the sponsor cares about most.
How to choose a few metrics for each initiative
If your organization has a talent management strategy, its objectives are a natural starting point. Here are the guidelines we use with clients while an initiative is being designed, before any measure is collected:
- Start with the business outcome the sponsor is trying to protect or improve. When we designed an international sales leadership development program for a global mining company, the business outcome was to protect customer retention and revenue through price increases, and the learning metrics were tied to the organization's known metrics of retention of priority accounts and the percentage of at-risk accounts with action plans. Our article on planning sales leadership development describes that program. The outcome came first and the metrics followed.
- Use data the organization already collects. Performance systems, the HRIS, the applicant tracking system and operational records often hold the measure you need. New surveys add effort for participants and their managers, and response rates fall with each one. Our article on training effectiveness measurement includes an example of tying measurement to metrics a field organization already observed.
- Choose two or three per area. One leading and one lagging indicator per system is enough for the scorecard. The rest can stay as diagnostic measures the team reviews without reporting upward.
- Define the measure and take the baseline before the initiative starts. A definition includes the population, the period, the data source and the formula. A baseline taken after a program has started is a progress reading, not a baseline.
- Decide the comparison. Before and after is the simplest. Participants compared with those still waiting for a later cohort is stronger and fits most rollouts. Attribution questions belong in that design rather than in the report afterward.
- Agree on governance. Who owns each number, who sees individual-level data and how results are shared back to participants. Involve bargaining units and works councils early where they are present, since data collected about individual performance often needs their agreement.
Boudreau and Ramstad make the case in Beyond HR that talent measures earn attention when the logic connecting them to business results comes first and the analytics and reporting follow [7]. The sequence above is that logic in practice.
Building a talent management scorecard
Kaplan and Norton's opening line in the original balanced scorecard article still applies to talent: what you measure is what you get [8]. A talent management scorecard is one page. It carries the four systems, two or three KPIs for each and, for every KPI, the baseline, the current value, the target, the trend and the owner. Here is an example of the layout, with illustrative values:
| System | KPI | Baseline | Current | Target | Owner |
|---|---|---|---|---|---|
| Strategic staffing | First-year retention of new hires | 78% | 83% | 88% | Head of talent acquisition |
| Strategic staffing | Quality of hire (at or above expectations at 12 months) | 61% | 66% | 75% | Head of talent acquisition |
| Succession planning | Key positions with a ready-now successor | 35% | 48% | 60% | VP human resources |
| Succession planning | Key-position vacancies filled internally | 40% | 55% | 65% | VP human resources |
| Management development | First-year turnover on teams of new managers | 19% | 15% | 12% | Director of talent development |
| Management development | On-time performance conversations | 62% | 80% | 90% | Director of talent development |
| Leadership development | Leadership roles with a ready-now successor | 30% | 40% | 55% | Chief learning officer |
| Leadership development | Participants improved on target behaviors at 90 days | Not measured | 84% | 85% | Chief learning officer |
A few practices keep the scorecard in use:
- Review it within the business cadence, at the quarterly business review rather than in a separate HR meeting, so the talent numbers sit next to the numbers they are meant to affect.
- Keep the definitions stable for at least a year. Changing a definition mid-year removes the trend, which is the most useful part of the page.
- Show the trend and the comparison, not the value alone. A coverage figure of 48% means little without the 35% it came from and the 60% it is heading toward.
- Keep the diagnostic measures behind the page. The full set from the tables above belongs in the HRIS or talent dashboard for the people who run each system; the scorecard carries only the KPIs.
- Reset the set once a year alongside the learning and development plan, so the metrics follow the priorities rather than the other way round.
Where talent management measurement goes wrong
- Activity instead of results. Completion rates, training hours and headcounts in programs describe effort. They belong in the diagnostic set, not on the scorecard.
- Too many measures. Forty metrics on a dashboard tend to produce no decisions. Two or three per system is the working number.
- No baseline. Without a starting point an improvement cannot be shown, and the initiative gets judged on anecdotes.
- Metrics without owners. A number nobody is accountable for drifts. Each KPI needs a leader who would act if it moved.
- Benchmarks in place of baselines. External figures are useful for scale and poor as targets, since definitions and conditions differ from one organization to the next.
- Results kept from the people measured. Sharing results back to participants and their managers is part of the process. It builds trust in the data and makes the next cycle easier to run.
Frequently asked questions
What are the four pillars of talent management?
Models differ. Many list acquisition, development, performance management and retention; others list attraction, development, engagement and retention. We organize talent management measurement around four systems that build people-capability, strategic staffing, succession planning, management development and leadership development, because each has a clear owner and produces results that can be measured on their own terms. Performance management and engagement are treated as inputs and outcomes across all four.
What is the difference between talent management metrics and KPIs?
A metric is any measure of how a talent system is performing. A KPI is a metric the organization has agreed to manage against, with a baseline, a target, an owner and a review cadence. A scorecard carries a small number of KPIs; the larger set of metrics stays with the people who run each system.
What are the most important talent management KPIs?
The ones tied to the outcomes your sponsors are trying to move. As a starting set we suggest one leading and one lagging indicator per system: quality of hire and first-year retention for staffing, succession coverage and internal fill rate for key positions, on-time performance conversations and early team turnover for management development, and bench strength for leadership roles and behavior change on target behaviors for leadership development.
How do you measure succession planning effectiveness?
By outcomes and leading indicators together: succession coverage (the share of key positions with a ready-now successor and with two or more candidates in the pool), internal fill rate and time to fill for key positions, retention of identified successors, completion of development actions and the performance of placed successors at six and twelve months, tracked from one talent review to the next. Our succession planning primer covers the process those measures sit inside.
How often should talent management metrics be reviewed?
Operational measures monthly, by the people running each system. The scorecard quarterly, with the business. The metric set itself once a year, when priorities are reset. Succession measures update after each talent review, which most organizations hold once or twice a year.
Who should own talent management metrics?
HR or talent development owns the definitions, the data quality and the reporting. Business leaders own the results, because the systems exist to serve their outcomes. Individual-level data should be visible to as few people as the purpose requires, with bargaining units and works councils involved where they are present, and participants should receive their own results.
Where to start
Pick one system with a sponsor who wants an answer, take the baseline on two measures this quarter and report them at the next business review. If you would like help moving the needle on these measures, our talent development consulting team partners with organizations on the initiatives behind them: development programs for managers and leaders, learning design and skill building for HR business partners and others in the talent space.
Contact us if you want help choosing your measures and building the initiatives that move them.
Start a conversation about talent management metrics
References
- International Organization for Standardization (2025). ISO 30414:2025, Human resource management: Requirements and recommendations for human capital reporting and disclosure (2nd ed.). iso.org.
- U.S. Securities and Exchange Commission (2020, August 26). Modernization of Regulation S-K Items 101, 103, and 105. Final rule, Release No. 33-10825; press release 2020-192. sec.gov.
- Navarra, K. (2022, April 11). The Real Costs of Recruitment. SHRM. shrm.org.
- Maurer, R. (2024, April 17). Succession Planning: Set Your Organization Up for Success. SHRM. shrm.org.
- Clifton, J. and Harter, J. (2019). It's the Manager. Gallup Press.
- Gallup (2026). State of the Global Workplace: 2026 Report. gallup.com.
- Boudreau, J. W. and Ramstad, P. M. (2007). Beyond HR: The New Science of Human Capital. Harvard Business School Press.
- Kaplan, R. S. and Norton, D. P. (1992). The Balanced Scorecard: Measures That Drive Performance. Harvard Business Review, January–February 1992.